Measuring Performance
The first step in optimizing your website is to find out where exactly it needs optimization. Although there are dozens of tools you could use to do this, you're well equipped with just the following two:
1. Chrome Developer Tools
Nowadays, every modern browser has its own set of "developer tools". It's not a huge difference if you use the tools built into Firefox, Safari or whatever your favorite browser is.
That being said, however, Google's Chrome browser has an above-average "Developer Tools" area. Combined with the fact that we have to agree on something for this tutorial, we'll go with Chrome in this guide.

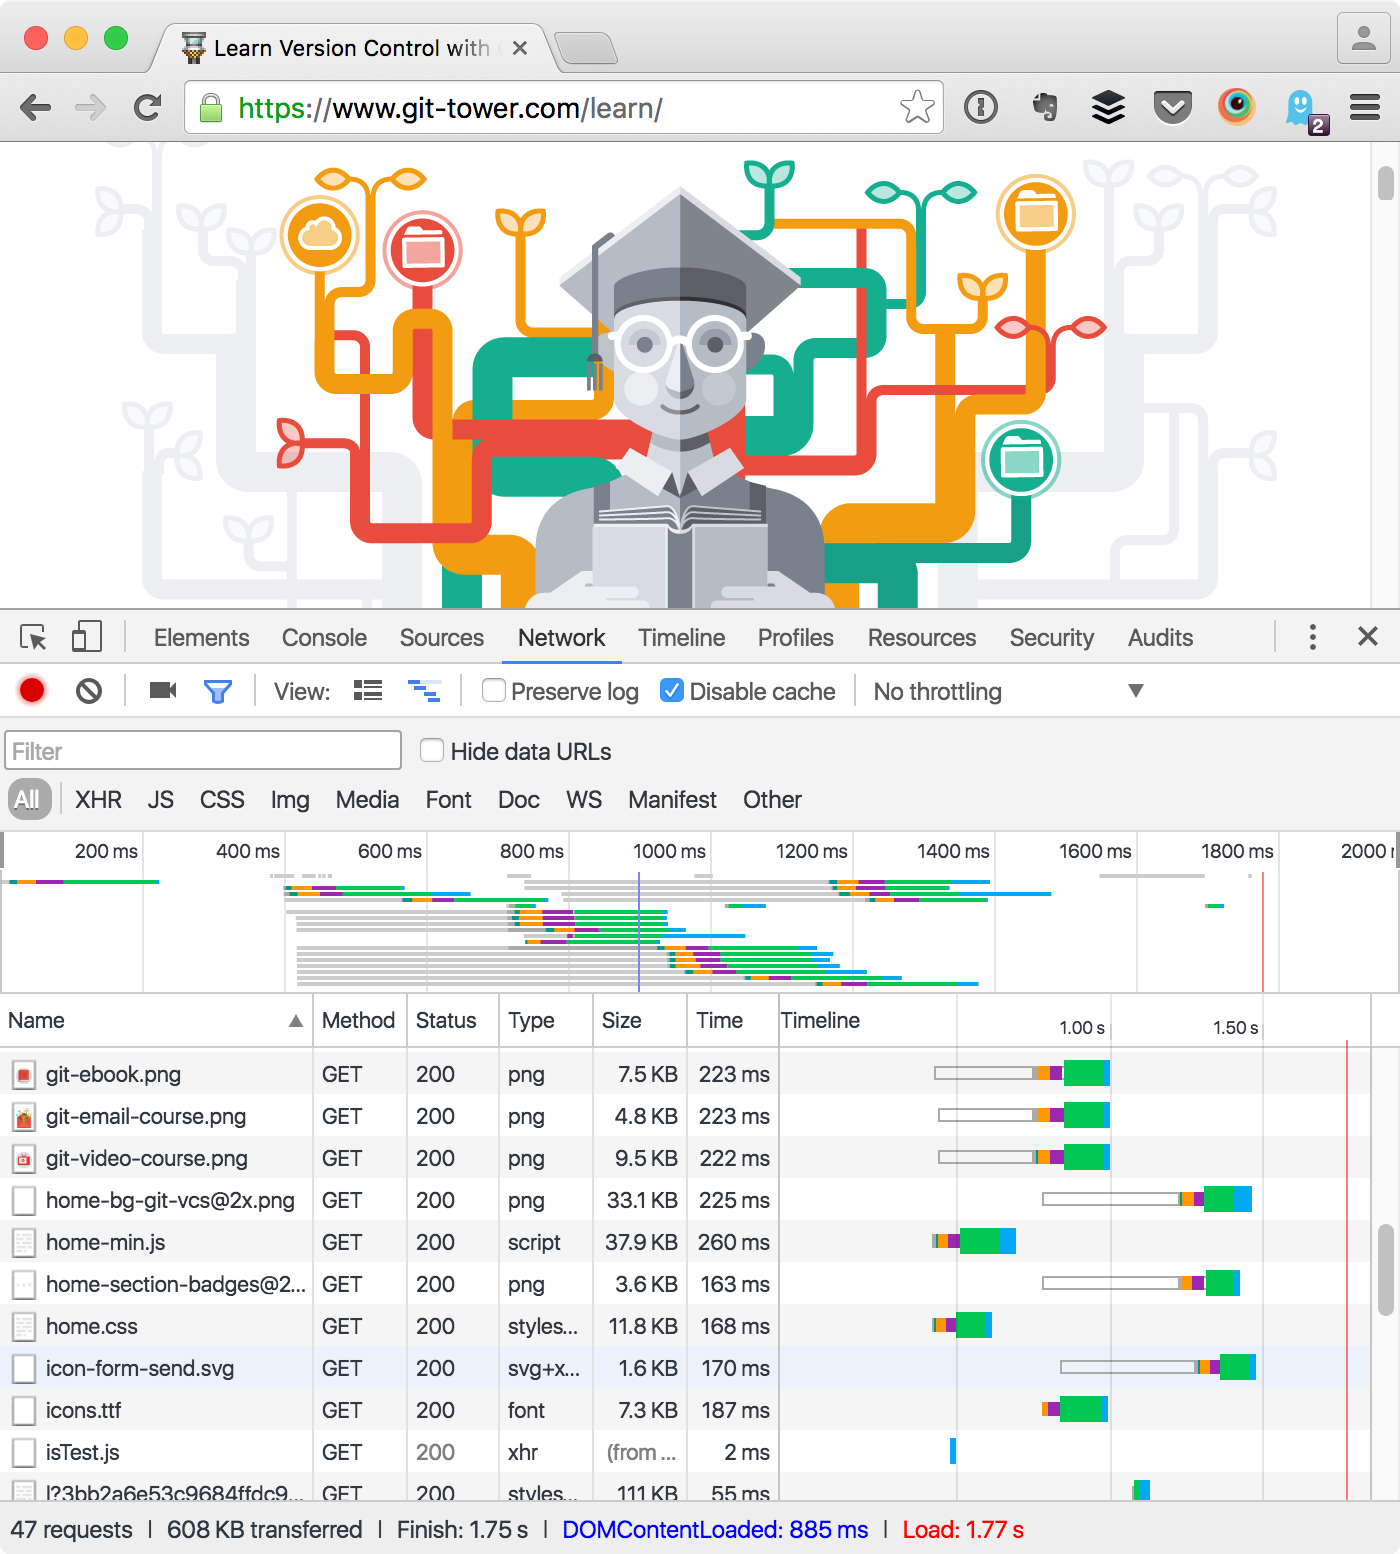
First, open the pane via the menu ("View > Developer > Developer Tools") or the corresponding keyboard shortcut (Cmd+Opt+I on Mac or Ctrl+Shift+I on Windows). Make sure to activate the "Network" tab to see performance-related data and have the "Disable Cache" checkbox activated; this ensures that we have the same experience a first-item visitor to our page has.
Now, to actually start recording data, simply reload the page. As soon as you do, you'll find the pane magically fills with bars and numbers. One could write long books about just the "Network" tab of Chrome's Developer Tools. But fortunately, only few parts are relevant for our use case:
Resources
The table in the lower area of the window lists all of the resources associated with this page. By default...
- Resources are sorted in the order they were requested. A useful alternative might be to sort them by their size (by clicking the "Size" column header). That way, you can identify big chunks of data that might slow down your page the most.
- All types of resources are shown. If at some point you only want to see images, for example, you can narrow the list by using the buttons in the filter bar (where currently the "All" button is selected).
Don't worry too much about the different bars and their colors. To speed up the general performance of a web page, it's more interesting to have a look at the overall stats at the bottom of the window.
Performance Summary
The footer of the Dev Tools window contains an interesting summary of performance metrics for our page. In detail, it informs us about the following topics (from left to right):
- Total number of requested resources
- Total file size that was transferred
- Loading times
In this guide, we will work hard on improving all of these numbers to get a faster experience for our visitors.
Chrome Dev Tools
We'll revisit the Chrome Dev Tools a couple of times in this guide. If you want to read an in-depth manual on just the Dev Tools, you can hop over to Google's own documentation.
2. Google PageSpeed
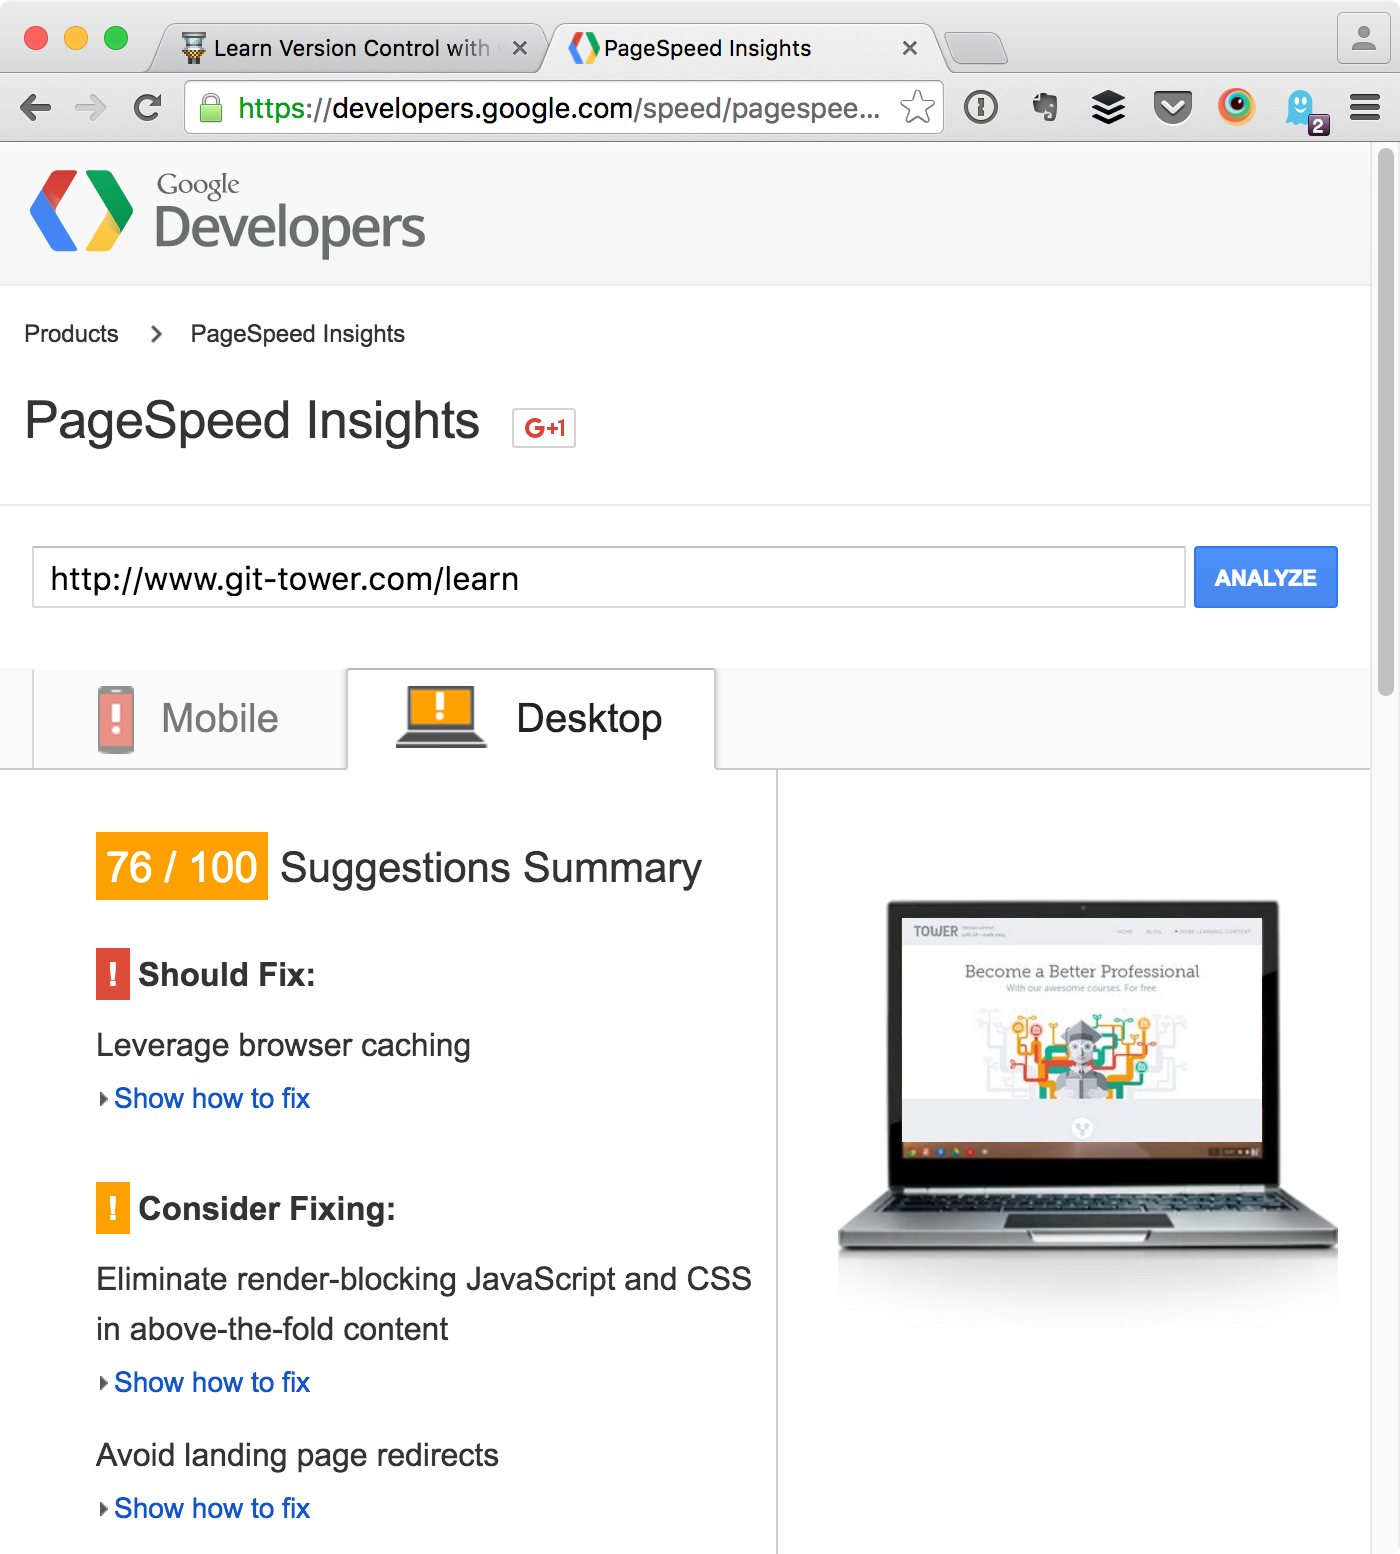
Another helpful tool is the Google PageSpeed analyzer:

When you feed it with a URL, it parses the page to find common performance problems. It's a great tool to help you understand your page's "status quo". Additionally, it directly provides some brief improvement hints.
In a Nutshell
Get an Overview of Tips & Techniques
Even if you find that your performance is perfect in one area or another, I still highly recommend looking at all of the techniques presented here. In your next project, the parameters and requirements might change - and you'll be glad you know how to bake performance right into your pages.
Get our popular Git Cheat Sheet for free!
You'll find the most important commands on the front and helpful best practice tips on the back. Over 100,000 developers have downloaded it to make Git a little bit easier.

About Us
As the makers of Tower, the best Git client for Mac and Windows, we help over 100,000 users in companies like Apple, Google, Amazon, Twitter, and Ebay get the most out of Git.
Just like with Tower, our mission with this platform is to help people become better professionals.
That's why we provide our guides, videos, and cheat sheets (about version control with Git and lots of other topics) for free.